Technical analysis in trading (TA) is an integral part of Forex trading. This tool is intended for analyzing graphs and making reasonable, well-thought-out decisions. TA is based on the assumption that the history of price fluctuations has a cyclical tendency, and therefore, the study of past actions can help predict future events. For this purpose, traders use various indicators that interpret market data and identify recommended entry/exit points for trades.
Technical analysis indicators are very popular among traders. This is partly due to the fact that all calculations are carried out by the machine. The trader receives only the result that he applies in practice.
Technical analysis indicators are algorithms that make it possible to obtain data on future prices with the help of data on quotations for a certain period of time.
Each technical analysis indicator is based on a certain formula. It is with its help that the calculation takes place. Depending on the type of indicator or its purpose, the formula may vary. For example, one calculates average prices for a certain period, the other calculates market closing or opening prices, and so on.
Technical analysis indicators can predict price reversals, show trading volumes, demand and supply, as well as many other important indicators.
Technical indicators are divided into four main categories:
- trending - with the help of such tools it is possible to determine the trend, its direction and reversal;
- oscillators - help to make a forecast of the price movement after a certain time. They perform their task well when there is no pronounced trend;
- volatility - intended for determining the average value of volatility;
- volume - determining trading volumes
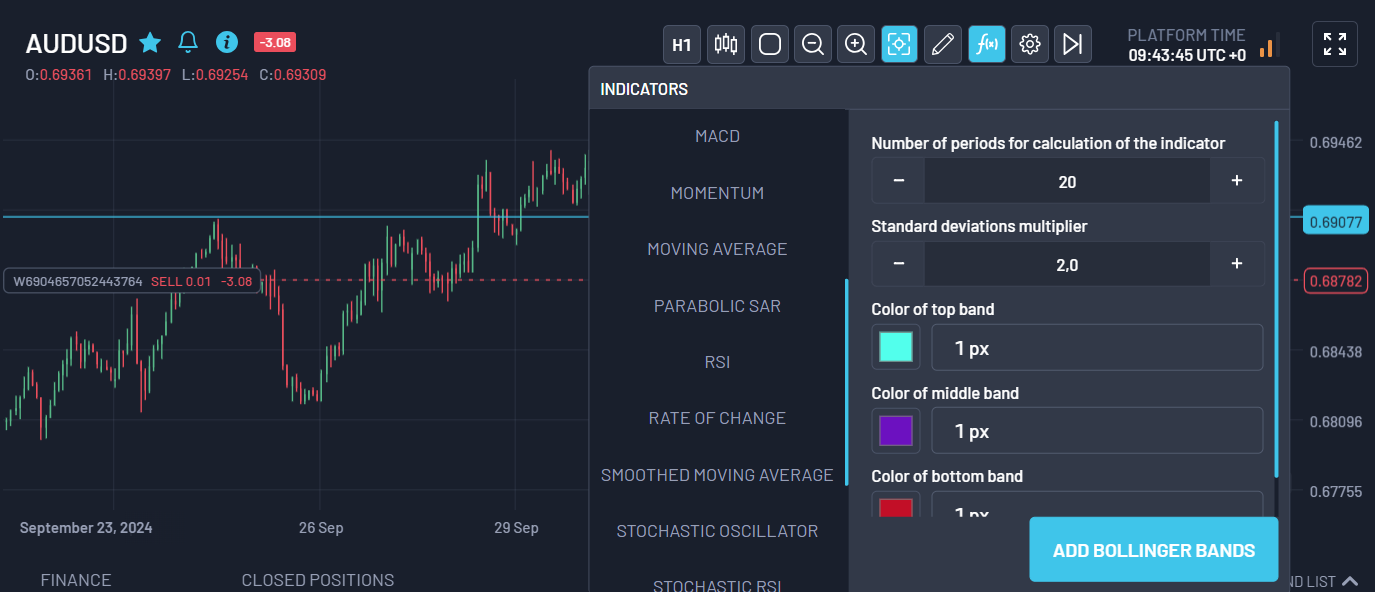
Let's take a look at the list of indicators on the ArtCap platform. You can find it by pressing on f(x) tab. So on the left you see the list of indicators and in the right side you can see setting for your indicator. Usually, the indicator settings are not changed. Although it depends on the tool you choose.
Let's look at how some indicators work. For example, let's take the Parabolic SAR trend indicator.
Parabolic SAR (Stop and Reverse) is a technical indicator that is mainly used by traders to determine the future direction of an asset's price. It is often used as a trailing stop loss indicator or to identify potential entry and exit points in a trend.
This indicator is displayed in the form of points located above or below the price bars on the chart.
How to interpret this indicator?
Parabolic SAR interpretation involves understanding the position of points in relation to price bars:
points below the price : when the points are below the price bars, it indicates an uptrend and suggests that the trader should maintain or open a long position.
points above the price : conversely, points above the price bars signal a downtrend, which is a recommendation for the trader to consider opening a short position or closing a long position.
The movement of points also plays an important role. As the trend develops, the dots begin to approach the price line, eventually stopping and reversing when the price crosses the price line. This crossing indicates a potential reversal in the direction of the market and is a signal for traders to review their positions.
After adding the indicator to the US500 tool, we see how the green dots show an upward trend, later a correction and a downward trend, and after that, the continuation of the upward movement again.
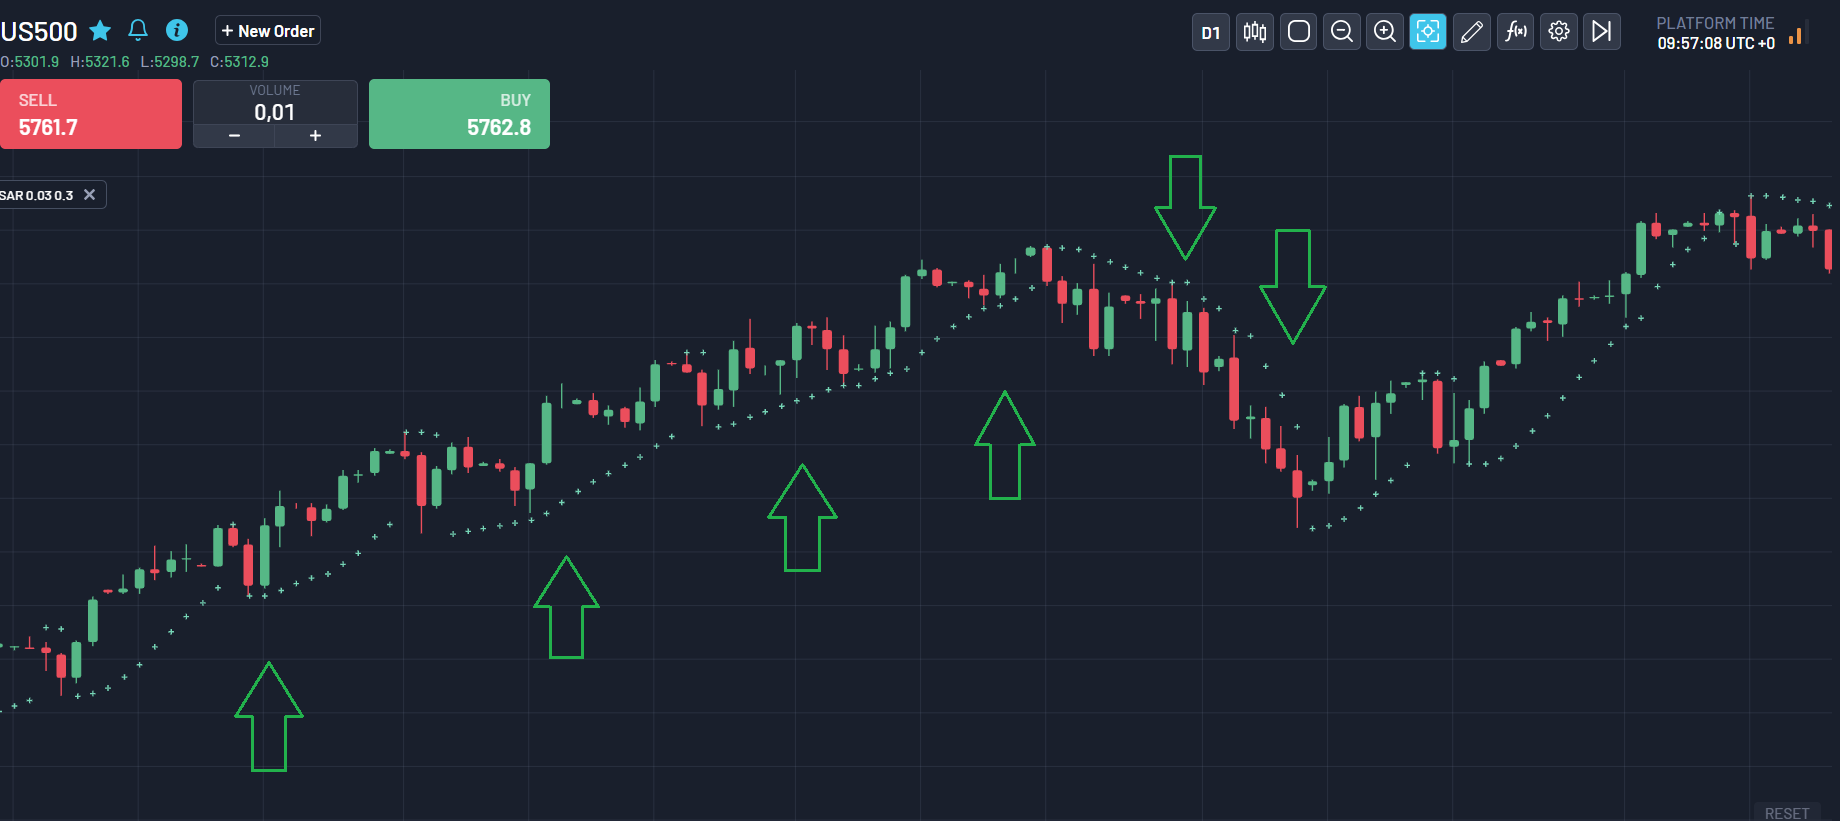
Parabolic SAR determines entry and exit points:
Buy Signal: Initiate a long position when the dots cross below the price candles, indicating bullish momentum. Open short positions when dots appear above the price, indicating a downtrend.
Sell signal: Crossing the points on the opposite side of the price indicates a potential reversal, signaling an exit or the beginning of a counterposition.
Now lets see how work Moving Average (SMA, EMA, WMA). This is one of the simplest, but most effective and popular indicators among traders.
SMA, EMA and WMA are similar, they differ only in the calculation formula, but they work in the same way. It is an indicator used to determine the direction of the current price trend without the intervention of short-term price spikes. The MA indicator combines the price points of a financial instrument over a specified time period and divides them by the number of data points to represent a single trend line.
Unlike the SMA, the EMA gives more weight to recent data points, making the data more responsive to new information. When used with other indicators, EMAs can help traders confirm significant market moves and assess their legitimacy.
The most popular exponential moving averages are the 12- and 26-day EMAs for short-term moving averages, while the 50- and 200-day EMAs are used as long-term trend indicators.
Now lets take a look on chart. Let's try to find good signal on AUDUSD. We use a simple strategy of crossing two MAs. You can test different periods. We chose SMA 26 and EMA 12.

As we can see, there was slow downward trend, later one line crosses another from the bottom up and the lines diverge, this tells us about a change in the trend and that the price will start to rise. This will be a signal to buy. As you can see, if we had opened a long position here, the forecast would have come true and we would have made a considerable profit.
The same situation occurs when in an upward trend one line crosses another from top to bottom, which indicates a change in the downward trend. And this would be a valid sell signal.
Try to test different configurations of this strategy depending on the timeframe you are working on. You can only use SMA, WMA, EMA. You can have two types like we have in the given example, or you can have only one MA. Maybe this indicator will become the "money" button for you.
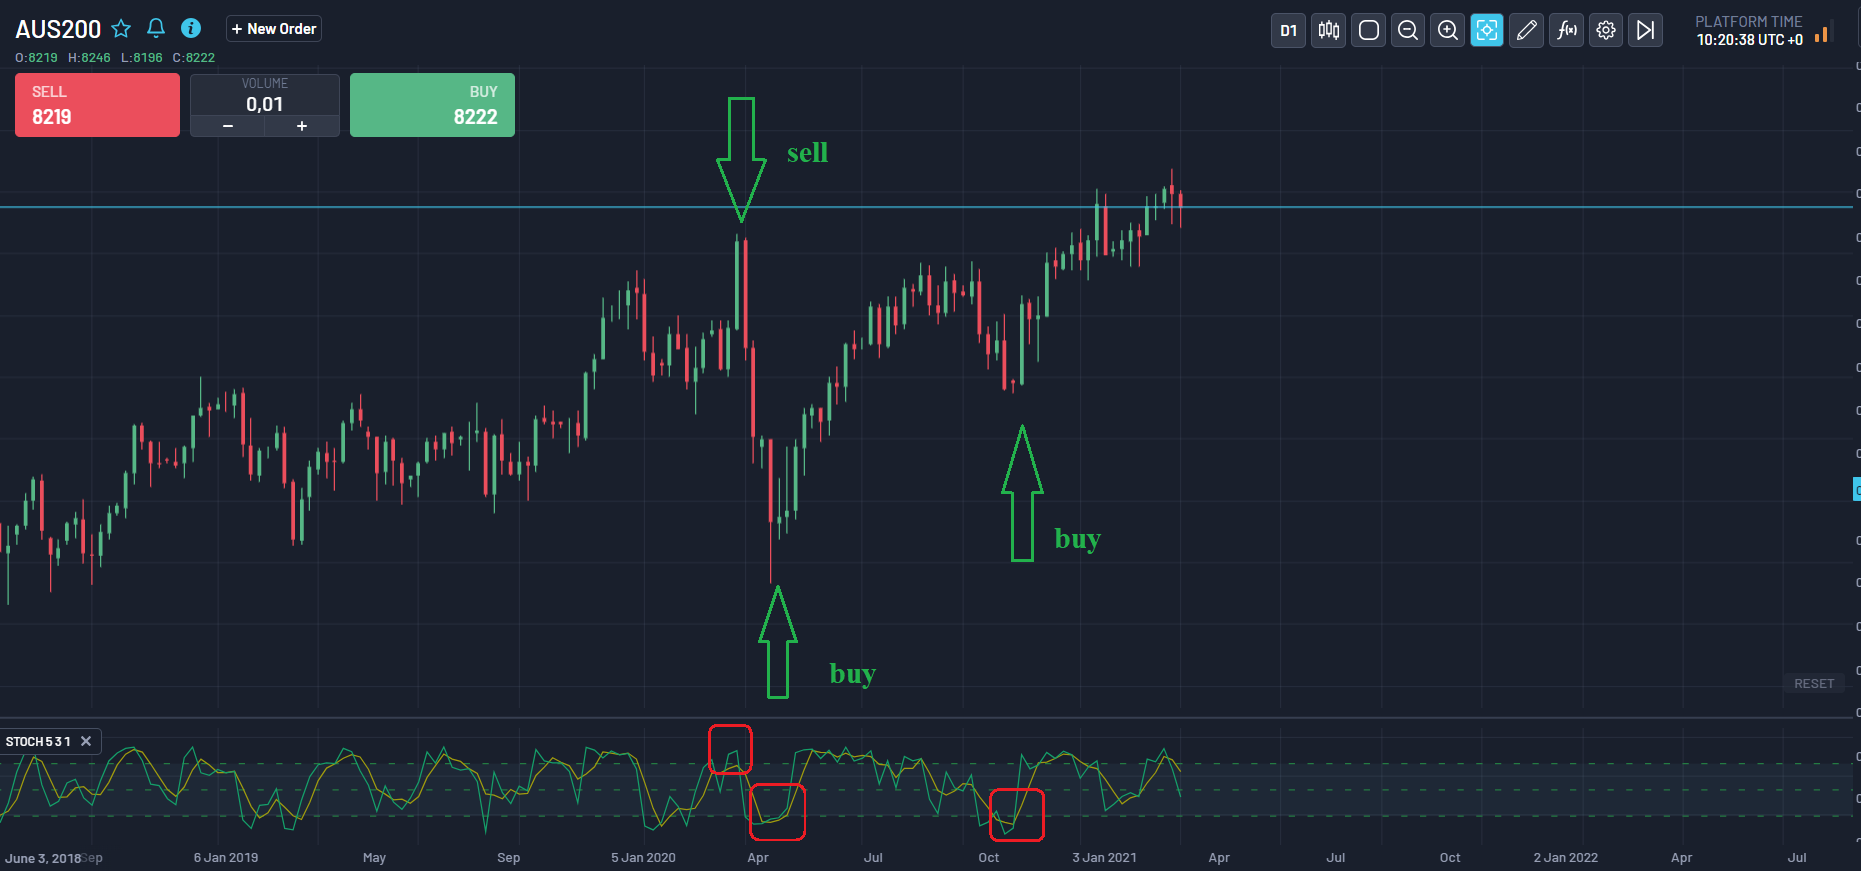
Now lets see what is Stochastic.
The simplest Stochastic Oscillator signal is the intersection of the main and dotted lines. Deals are opened in the direction of the intersection of the lines: if the fast (solid) line crosses the slow (dashed) line from the bottom up, a purchase deal is opened, if the opposite is the case, a sale deal is opened.
It should be borne in mind that Stochastic is one of the sharpest oscillators, and it will give many signals, many of which will be false. Therefore, when trading using this method, it is necessary to at least set a hard stop loss.
When Stochastic goes above the upper or lower level, this indicates that the current price is significantly lower or higher than the previous values. Thus, a local overbought or oversold market is created, which can be used for trading.
It makes sense to open purchase deals when the indicator first drops into the oversold zone, and then crosses the lower level from bottom to top. Sales transactions are opened in a mirror situation. In order to reduce the number of false alarms, it is recommended to skip the entrance to the zone of only one, fast line.
Overbought and oversold trading makes sense only in the flat. In periods of a strong trend, Stochastic enters the zone quite quickly, however, the price may continue to move in the same direction even after both lines cross the level in the opposite direction.
What is the best indicator for trading
It is necessary to understand that the concept of an exceptionally best indicator does not exist. Each tool has its advantages and limitations. Which of them to choose, as already mentioned, will depend on the individual preferences of the trader, his trading strategy, and also on the characteristics of the market.
Some traders choose moving averages for their simplicity and ability to show the general direction of the trend. Others prefer RSI or MACD because they indicate whether an asset is overbought or oversold. It is necessary to understand that one indicator can be effective in certain market conditions, but not as successful when they change. In addition, it is necessary to consider that many effective trading strategies do not involve the use of a single indicator. Several such tools are combined to confirm signals.
Do not look for the best method for technical analysis. It is necessary to focus your efforts on understanding the operation of such tools, learn to evaluate their strengths and weaknesses. No less important is the ability to interpret signals in the current market situation. Effective use of indicators requires careful checking, adaptation to market conditions and testing on historical data to develop a successful trading strategy.
We wish you successful trading with ArtСap !