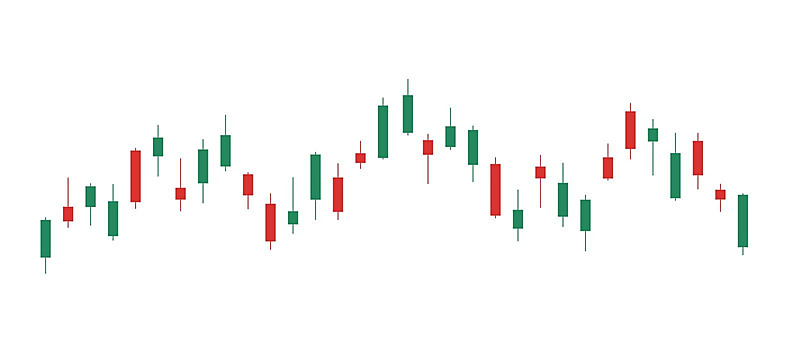
 Japanese candlesticks first began to be used on charts around 1850. Their image symbolizes the battle between bulls (buyers) and bears (sellers) on certain time frames. From them you can calculate price dynamics. You need to analyze the body of the candle and its shadows in the form of vertical edges at the top and bottom. Japanese candlestick charts provide a better understanding of the market situation than linear charts. That is why both traders and investors love them. This is one of the favorite analysis tools.
Each candlestick can tell you 4 things:
- opening price
- maximum (high) price movement
- closing price
- minimum (low) price movement.
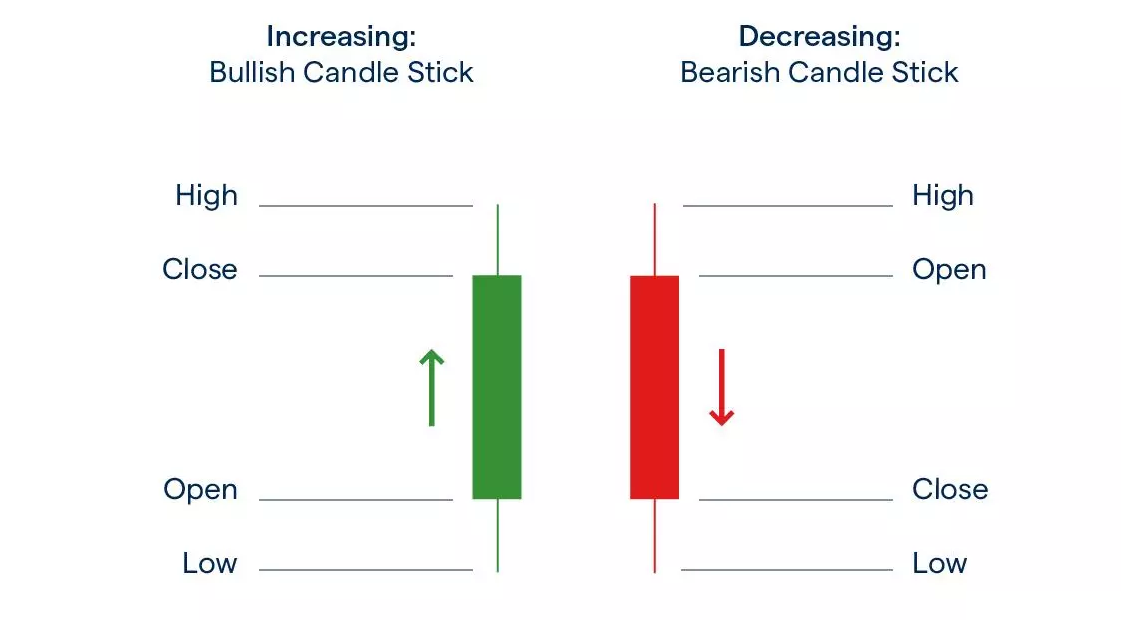
When the closing price is higher than the opening price, the candlestick turns green, signaling an uptrend. If the closing price is lower than the opening price, the candlestick turns red, and This indicates a price drop. Japanese candlesticks are useful for tracking market trends and even making forecasts.
If the wick is even taller than a long body, it shows that there was a high level of volatility within the period. So bulls and bears may have been vying for control, with bulls eventually winning out.
A short red body with a high upper wick, meanwhile, indicates that bulls pushed a market’s price higher, but were beaten back by bears before close. And if there’s no wick at all, you know that the open or closing price was also the high/low.
Some patterns are taken as indications of probable future movement by technical traders. The theory here is straightforward – these patterns reveal particular behaviour that has often led to specific outcomes in the past.
There are three types of candlestick pattern: single, double and triple. This is based on the number of sticks that make up the pattern.
While past performance is no guarantee of future price movement, these patterns can be useful when spotting opportunities. Let’s take a look at some popular examples.
Spinning tops
A spinning top is formed when a candlestick has a long wick both above and below a narrow body. So the market had an extensive trading range, but little difference between its open and close.

In a jig there is a tug of war between buyers and sellers. But the bears and the bulls offset each other, so there is little in the way of actual movement.
Technical traders perceive spikes as a sign of weakness in the current trend. If the market forms a rotating top after a long rally, then the positive sentiment may end. Meanwhile, after a downward trend, positive opinion may increase.
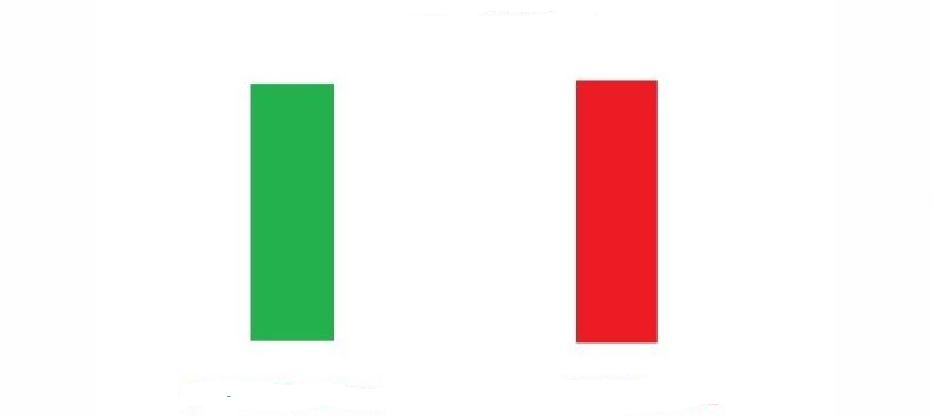
Marubozu
Marubozu comes from the Japanese word for "bald". This means a candlestick that has no wick at all.
The green marubozo opened and closed at the lowest and highest levels respectively.
The red marubozo opened and closed at the highest and lowest levels respectively. Marubozu indicates a confident price movement depending on the color of the candle.
Doji
In a doji pattern, the open and close prices are exactly equal (or almost exactly equal). So the body appears as a very thin line – typically less than 5% of the total range of the period.
Like spinning tops, this can tell you that the bulls and bears have cancelled each other out by the end of the session.
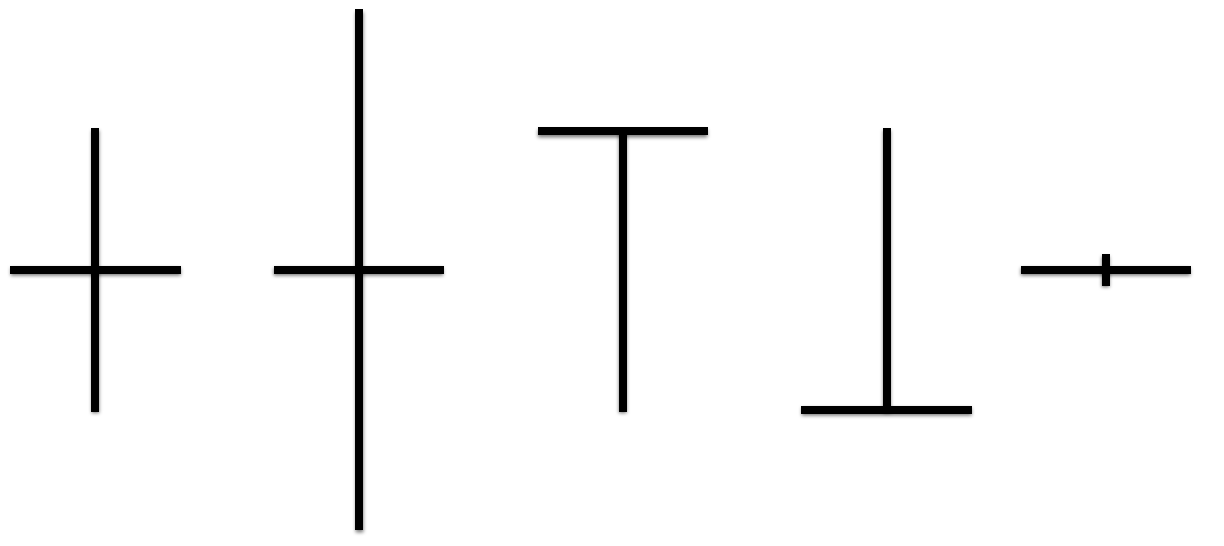
Doji are often taken as an indication of an upcoming reversal. If a market forms a after an extensive uptrend, then it may be about to head back down. After a bear move, selling sentiment could be exhausted, meaning bulls are about to take over.
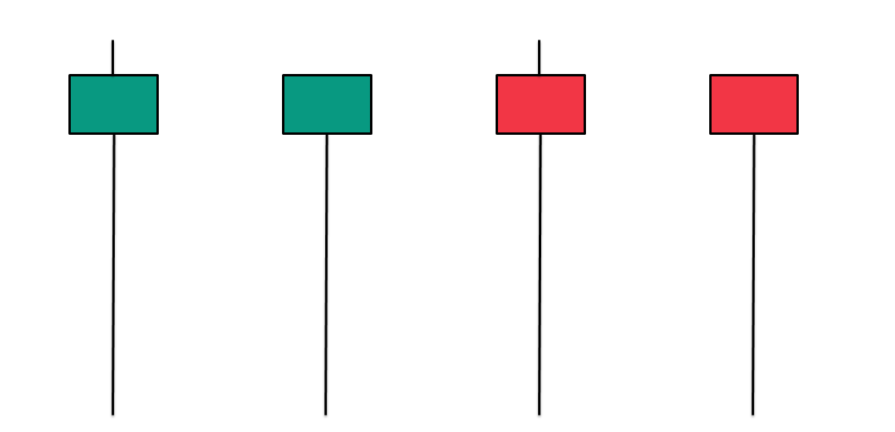
Hammer
If a market forms a hammer after an extended move down, then technical traders believe that it might be about to mount a bullish fightback.
You can spot a hammer by its long wick below a comparatively short body, with little to no wick above. The body should be two to three times shorter than the lower wick.
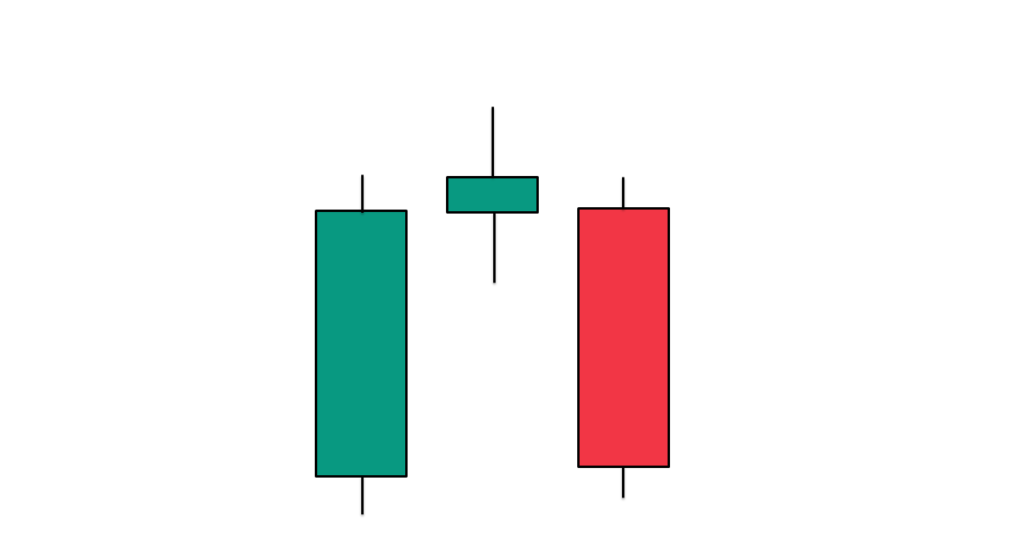
An evening star
The figure consists of three candles: a long green one, a small one through the window up, and a long red one through the window down. Such a figure shows a negative mood in the market, and when it is detected, one should be ready to sell a financial instrument.
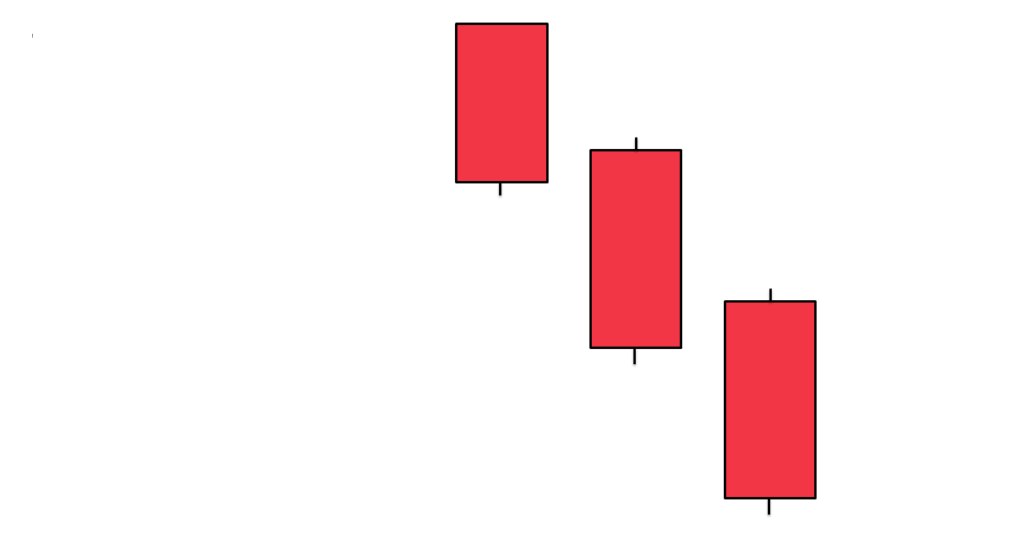
Three black crows
It appears after an uptrend, consists of three consecutive longer red candles and is taken as a strong signal that the bull market is over.
The second candle should have a short or no lower wick, and the third candle should have almost none.
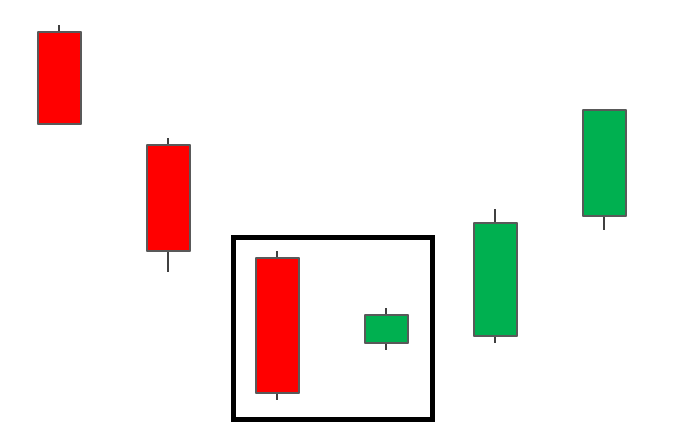
Harami candlestick pattern
On the picture below we see Harami bullish candlestick pattern. It is a reversal pattern that appears at the bottom of a downtrend. It consists of a bearish candle with a large body, followed by a bullish candle with a small body, completely within the range of the body of the red candle. The second candle signals a possible change in the momentum, ideally it opens around the middle of the range of the previous candle.
These are just some models of Japanese candles and patterns. There are a large number of them that you can familiarize yourself with. Based on the shape of a single candle, the moment of its appearance and the combination it forms with neighboring elements, it is possible to predict further market movements with high probability, identify trend turning points, find confirmations of signals from other indicators, and therefore conclude trades exactly when it is necessary, avoiding mistakes and losses.
We wish you successful trading with ArtСap !